CHENG LOONG
Download Center
Language
EN
中文
About CLC
Businesses
Investors
ESG
Human Resource
Press Center
Contact us
Search
EN
中文
Back
Company Profile
Vision & Mission
Management Policies
Milestones
CLC Information
Business Overview
Organization
Executives
Recognition
Locations
Industrial Paper
Business
Products
Contact
Process
Corrugated Container
Business
Products
Technical Services
Contact
Process
Agricultural Paper
Business
Products
Household Product
Business
Contact
Paper & Paperboard
Business
Contact
Form & Packaging Materials
Business
Products
Contact
Paper Art
Business
Contact
Construction & Rental
Business
Contact
Affiliates
Business
Financials
Monthly Revenues
Financial Report
Investor Presentation
Shareholders' Meeting
Meeting Announcement
Annual Report
Meeting Agenda
Meeting Minutes
Top10 Shareholders
Meeting Video
Corporate Governance
Board of Directors
Committee
Internal Audit
Risk Management
Ethical Management
Major Regulations
CLC Announcement
Stock Quotes & Dividends
Stock Quotes
Dividends
Shareholder Services
CSR
Sustainability Practice
Supply Chain Management
Climate change Action
Talent Development
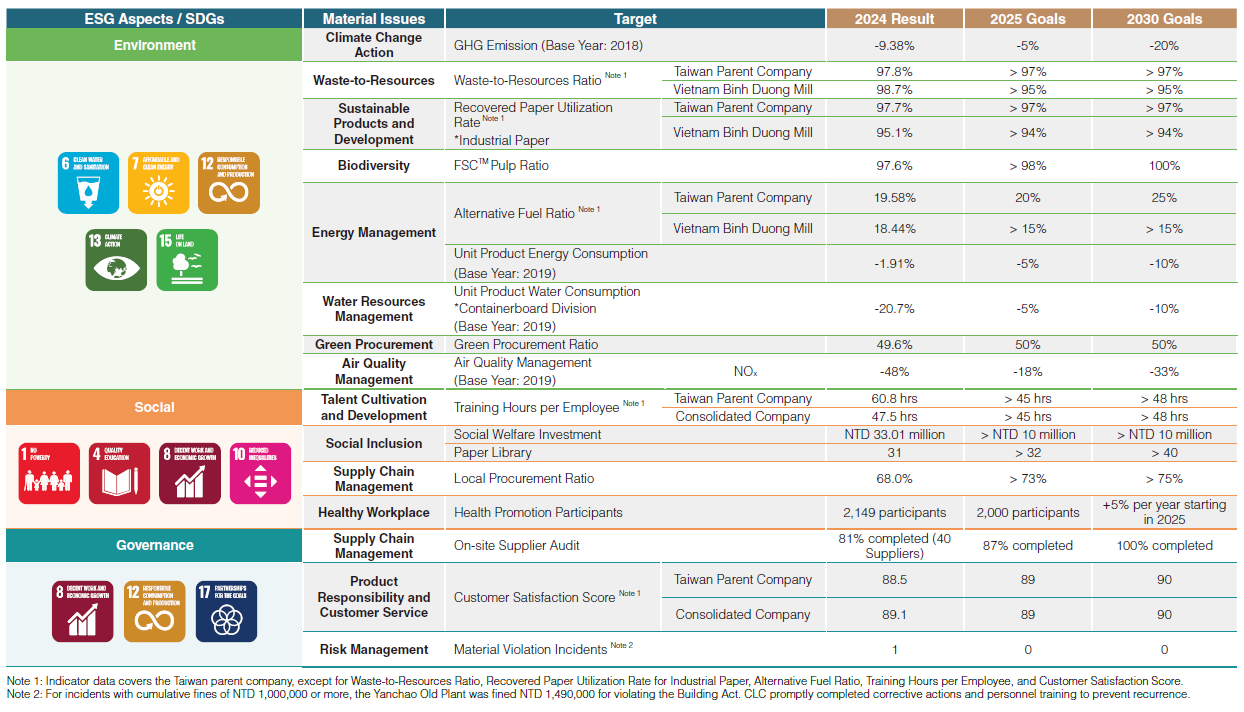
ESG Goals & Results
Goals
ESG Results
Sustainability Governance
Message from Top Management
ESG Strategy and Sustainability Committee
Corporate Goverence
Identification of Material Issues
Sustainable Products and Development
Circular Economy
Sustainable Products and Development
Product Responsibility and Customer Service
Sustainable Supply Chain
Supply Chain Management
Green Procurement
Environmental Sustainability
TNFD & Biodiversity
Action for Climate Change
Energy Management
Water Management
Air Quality Management
Waste to Resources
Happy Workplace
Diversity and Equal Opportunity
Talent Cultivation and Development
Healthy Workplace
Human Rights Policy
Society
Secondary Forest
Care for Children
Social Participation
Emergency Assistance
Interaction
Sustainability Reports
Videos
CSR interaction
ESG Survey
Stakeholder Contacts
Join CLC
Employee Benefits
Career at CLC
MOPS #1904
CLC Announcement
Press Release
Download Center
Urban Renewal
Environmental Disclosure Report
Factory Certificates
Shareholder Information
Management Certificates
Test Reports
Environmental Certificates
Videos
Locations
ESG
Business Conduct
Agricultural Paper
Customer Service
Industrial Paper
Corrugated Container
Household Product
Paper & Paperboard
Form & Packaging Materials
Paper Art
Construction & Rental
Spokesperson
Investor Relations
Shareholder Services
Supplier
Human Resource
ESG Performance and Goals
Goals
ESG Results
ESG Goals
上一則
下一則